CNBC's Top States for Business Rankings - it's complicated
Annual rankings see annual methodology changes
The state political and business worlds collide once a year in CNBC’s annual Top States for Business rankings.

Over the years I have been critical of these rankings due to the changing methodology; however, since Virginia has an election of consequence every year, it actually helps the business community in the long run.
So, thanks CNBC! You focus folks on the focus.
The expectation in Virginia is that we do well in these rankings since we have the most #1 rankings of any state since the rankings began in 2007.
CNBC’s rankings have become catnip for the comms departments of political campaigns with both parties fighting over who gets more credit or blame for the current ranking.
BUT since this is the most in depth rankings that we have to go on, let’s do some rational analysis of how the Commonwealth is actually doing overall.
From there, we can start to address what Virginia needs to do in order to be consistently #1. (Not that the election will turn on it…)
Virginia is, on average, #2.
While no one aspires to the Silver Medal in the Olympics, let’s freely admit that we’re pretty damn good.
Okay?
According to CNBC.
Comparative Analysis
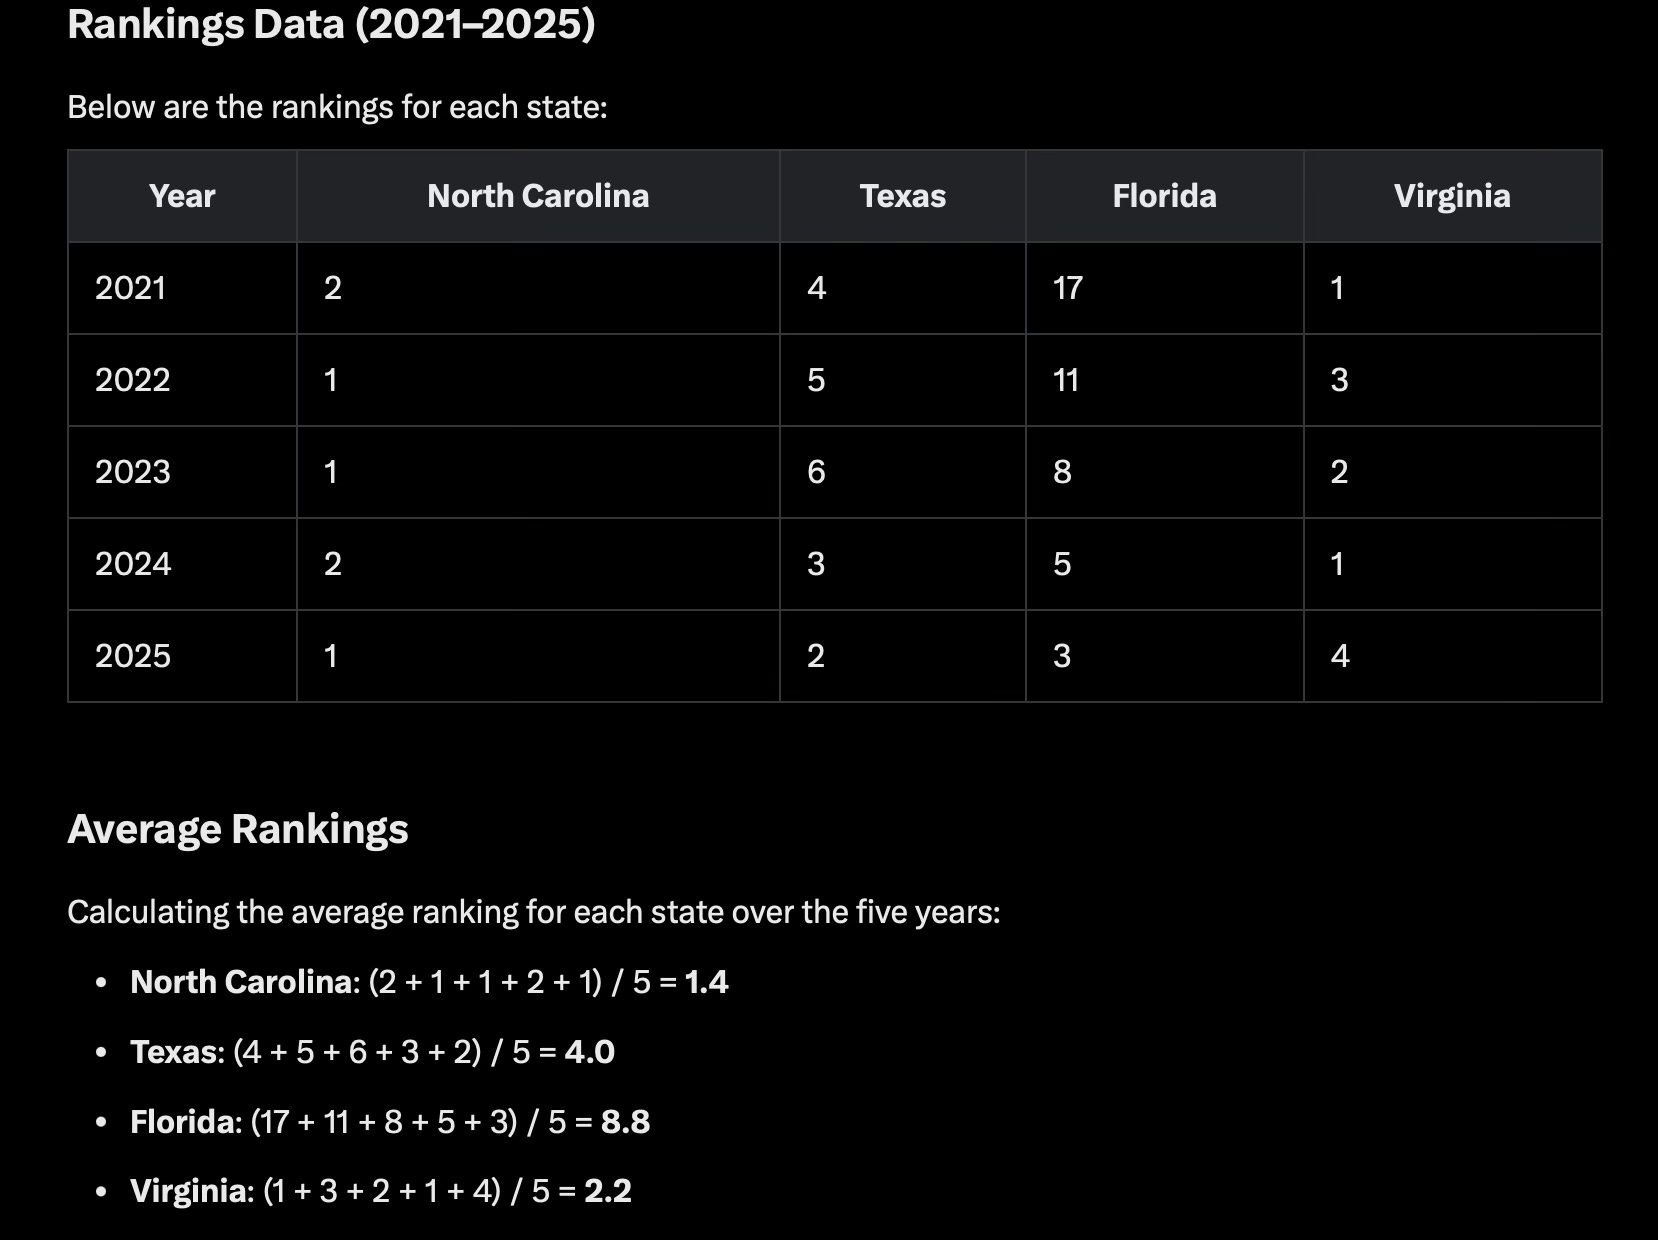
Rankings Summary
North Carolina: Average rank 1.4, with three #1 finishes (2022, 2023, 2025) and two #2 finishes (2021, 2024). It is the most consistent top performer.
Virginia: Average rank 2.2, with two #1 finishes (2021, 2024), one #2 (2023), one #3 (2022), and one #4 (2025). Highly competitive but slipped in 2025.
Texas: Average rank 4.0, consistently in the top six, with a high of #2 (2025) and a low of #6 (2023). Shows steady improvement.
Florida: Average rank 8.8, with a high of #3 (2025) and a low of #17 (2021). Demonstrates significant improvement after a weak 2021.
Performance Trends
1. North Carolina:
Strengths: Excels in Workforce (#1 in 2023, #3 in 2024, #4 in 2025) and Economy (#3 in 2025, #4 in 2024), driven by talent attraction programs (e.g., Longleaf Commitment Community College Grants, Finish Line Grants) and major investments (e.g., Amazon’s $10 billion data center, JetZero’s 14,500-job factory).
Weaknesses: Struggles in Quality of Life (#32 in 2024, D+ in 2023) due to childcare affordability and voting rights issues, and Infrastructure (#20 in 2024) due to $20 billion in water utility repair needs.
Trend: North Carolina’s dominance (top three for six straight years) reflects its business-friendly environment and workforce strength. Its 2025 win, despite trade war risks (e.g., Wilmington port vulnerabilities), shows resilience.
2. Virginia:
Strengths: Leads in Education(#1 in 2024) and Infrastructure (#3 in 2024), with the world’s largest data center hub (70% of global internet traffic) and a strong site readiness program. AI readiness (#4 in 2024) enhances its appeal.
Weaknesses: The 2025 drop to #4 was due to new CNBC metrics on federal budget cut risks, given Virginia’s reliance on federal jobs. Slowing net migration of college-educated workers weakened its Workforce ranking.
Trend: Virginia’s record six wins (2007, 2009, 2011, 2019, 2021, 2024) highlight its consistency, but 2025’s slip shows vulnerability to federal policy shifts. Its education and infrastructure strengths keep it competitive.
3. Texas:
Strengths: Tops Workforce in 2024 and 2025, driven by strong in-migration (per Lightcast’s worker attraction index). High rankings in Economy (#2 in 2023) and Access to Capital (tied #1 in 2023) reflect major corporate investments.
Weaknesses: Poor Quality of Life (#49 in 2025, #50 in 2024) due to high uninsured rates, crime, and weak worker protections. Infrastructure (#26 in 2024) is hindered by power grid issues and no site readiness program.
Trend: Texas’s climb from #6 (2023) to #2 (2025) shows momentum, with its #4 rank in 2021 reinforcing its consistency. However, quality of life and infrastructure weaknesses limit its top-tier potential.
4. Florida:
Strengths: Dominates Economy (#1 in 2023, 2024, 2025), with strong job growth and a robust housing market, though challenged by rising insurance costs. Its business-friendly policies drive its climb from #17 (2021) to #3 (2025).
Weaknesses: Faces challenges in Infrastructure due to climate risks and an unreliable power grid. Quality of Life (#38 in 2024) and high Cost of Living (#3 most expensive in 2025) are drawbacks. The #17 rank in 2021 and #11 in 2022 reflect post-pandemic challenges (e.g, tourism recovery, workforce issues).
Trend: Florida’s improvement from #17 (2021) to #11 (2022) to #3 (2025) highlights economic resilience, but its weaker early performance lowers its average, reflecting less consistency than North Carolina or Virginia.
Comparative Insights
North Carolina vs. Virginia: North Carolina’s 1.4 average outpaces Virginia’s 2.2, driven by consistent workforce and economic strengths. The 2024 race was the closest ever (Virginia: 1,595 points, North Carolina: 1,592), but Virginia’s 2025 drop to #4 due to federal job cut risks highlights a vulnerability. North Carolina’s broader economic base (e.g., private sector investments) gives it an edge.
Texas’s Consistency: Texas’s 4.0 average reflects steady top-six performance, with its #2 rank in 2025 showing momentum. Its #4 rank in 2021 adds to its competitive profile, but quality of life and infrastructure weaknesses prevent it from challenging North Carolina or Virginia for #1.
Florida’s Volatility: Florida’s 8.8 average, driven by a weak #17 in 2021 and #11 in 2022, highlights a challenging post-pandemic start but a strong recovery to #3 in 2025. Its economic strength is offset by infrastructure and cost challenges, making it less competitive than North Carolina or Virginia.
Methodology Impact: CNBC’s methodology, with 135 metrics in 2025 (up from 85 in 2021), emphasizes Economy (2025), Infrastructure (2024), and new factors like AI readiness and trade war risks. Virginia’s 2024 win leveraged its infrastructure and education strengths, while North Carolina’s 2025 win aligned with workforce and economy priorities. Florida’s low 2021 and 2022 ranks reflect post-pandemic methodology shifts (e.g., workforce recovery, inclusivity), with its later gains driven by economic performance.
Regional Context: Position North Carolina’s dominance (1.4 average, three #1 finishes) as a regional benchmark. Highlight complementary strengths (Virginia’s infrastructure, North Carolina’s workforce) to propose collaborative opportunities with Montreal’s tech and trade sectors.
Florida’s Recovery: Note Florida’s climb from #17 (2021) to #11 (2022) to #3 (2025), signaling a competitive Southeast. Position Virginia as a stable, balanced partner compared to Florida’s infrastructure and cost challenges, appealing to Montreal businesses seeking reliable U.S. partners.
Texas’s Momentum: Acknowledge Texas’s 4.0 average and #2 rank in 2025, driven by workforce strength.
Critical Notes
Methodology Bias: CNBC’s reliance on states’ marketing pitches for category weightings may favor North Carolina’s aggressive workforce promotion. Virginia must enhance its economic development PR to influence future weightings.
Limitations: Florida’s #17 rank in 2021 and #11 in 2022 suggest methodology shifts (e.g., post-pandemic workforce or inclusivity metrics) impacted its early performance. Rankings may oversimplify complex factors, like Virginia’s federal job reliance or Florida’s climate risks.
Skepticism: Economic development professionals caution against over-relying on rankings for site selection, as they may not capture local nuances.
Yeah…about that Methodology
Over the years, the methodology has evolved to reflect changing economic priorities, business needs, and emerging trends.
The core framework remains consistent—scoring states across 10 categories of competitiveness using a points-based system (maximum 2,500 points)—but the number of metrics, category weightings, and specific considerations have been updated to stay relevant.
Below is an overview of how the methodology has changed:
Core Methodology (Consistent Across Years)
Categories: The rankings assess states across 10 broad categories: Workforce, Infrastructure, Economy, Cost of Doing Business, Business Friendliness, Education, Access to Capital, Technology and Innovation, Quality of Life (or Life, Health & Inclusion), and Cost of Living. These categories are derived from factors businesses prioritize in site selection and states emphasize in economic development marketing.
Weighting: Each category’s weight is determined by how frequently states highlight it in their economic development pitches, ensuring the rankings reflect what states market as their strengths. For example, if more states promote their workforce, that category gains more points.
Data-Driven Approach: The study avoids opinion surveys, relying on publicly available data (e.g., federal databases, state financial reports) and third-party sources like CoStar Group (real estate), Lightcast (labor market), and First Street Foundation (climate risk). States are scored on a maximum of 2,500 points, with the highest-scoring state named the Top State for Business.
Letter Grades: Since 2018, states receive letter grades for each category (scaled from 50% to 100%) to show relative performance, though rankings are based solely on points
Key Changes in Methodology Over Time
1. Increasing Number of Metrics:
The number of metrics used to score states has grown significantly, reflecting a more granular approach:
2017: 60+ metrics across 10 categories.
2018: 88 metrics.
2021: 85 metrics.
2023: 86 metrics.
2024: 128 metrics.
2025: 135 metrics, the highest ever, to capture a broader range of competitive factors.
The increase allows CNBC to incorporate emerging trends and more detailed data, such as specific infrastructure or technology metrics.
2. Shifting Category Weightings
Category weightings change annually based on states’ marketing priorities:
2023: Workforce was the heaviest-weighted category, reflecting post-pandemic labor shortages and the focus on talent attraction. Infrastructure, Economy, and Life, Health & Inclusion followed.
2024: Infrastructure became the top-weighted category, emphasizing shovel-ready sites, data center capacity, and energy reliability (e.g., Virginia’s strength in certified sites).
2025: Economy took the top spot due to recession fears, with increased emphasis on Cost of Doing Business and Cost of Living amid persistent inflation concerns.
This dynamic weighting ensures the rankings align with current business priorities, such as economic stability or infrastructure readiness.
3. New and Enhanced Metrics:
2021: Post-pandemic changes included new metrics on diversity, equity, and inclusion (e.g., Virginia’s voting rights and anti-discrimination laws) and sustainability (e.g., environmental policies). Connectivity was also added to reflect remote work trends
2024: Infrastructure metrics were enhanced with data from the Site Selectors Guild on site readiness programs, certified site inventory, and investment in site development. Artificial intelligence (AI) readiness was introduced, with Virginia ranking fourth due to its data center dominance.
2025: New metrics were added to gauge states’ exposure to trade war risks (e.g., tariffs impacting ports like Wilmington, NC) and shrinking federal budgets (e.g., Virginia’s vulnerability to federal job cuts). Infrastructure metrics were further refined to assess power and data demands, reflecting the growing needs of tech-driven businesses like data centers.
4. Incorporation of Emerging Trends:
Climate and Sustainability: Since at least 2023, CNBC has included sustainability data (e.g., from First Street Foundation) to evaluate states’ preparedness for climate change and extreme weather. This reflects growing corporate focus on environmental resilience
AI and Technology: The 2024 and 2025 rankings introduced AI readiness metrics, acknowledging the increasing importance of tech infrastructure (e.g., data centers, broadband access).
Trade and Federal Policy: In 2025, metrics addressing trade war risks and federal budget cuts were added, driven by policy shifts under the Trump administration, such as tariffs and reduced federal spending, which impact states differently (e.g., Virginia’s federal job reliance).
5. Data Sources and Partnerships:
Over time, CNBC has expanded its data sources to include specialized partners:
CoStar Group: Provides real estate cost and availability data for Infrastructure and Cost of Doing Business
Lightcast: Develops a State Talent Attraction Scorecard for the Workforce category.
First Street Foundation and Cotality : Supply climate risk and property resilience data for Infrastructure.
Site Selectors Guild: Added in 2024 for site readiness data, enhancing Infrastructure metrics.
These partnerships allow for more precise measurements, moving beyond federal databases to include industry-specific data.
6. Response to Economic and Policy Shifts:
The methodology adapts to macroeconomic and political changes:
Post-2008 Recession (2007–2017): Early rankings focused heavily on cost factors (e.g., taxes, wages) and economic recovery metrics like job growth and GDP.
Post-Pandemic (2021): Emphasis on workforce availability, remote work infrastructure, and inclusivity metrics (e.g., Virginia’s voting rights laws) reflected pandemic-driven shifts.
2025 (Trump Policies): New metrics on trade war risks and federal budget cuts address tariffs and reduced federal spending, impacting states like North Carolina (port traffic) and Virginia (federal jobs).
Impact on Rankings
Virginia’s Performance: Virginia has won the top spot six times (2007, 2009, 2011, 2019, 2021, 2024), driven by its education system and infrastructure. However, in 2025, it slipped to its lowest ranking since 2018 due to federal job cut risks, showing how new metrics like federal budget exposure can shift outcomes.
North Carolina’s Rise: North Carolina’s consistent top-three rankings (first in 2022, 2023, 2025; second in 2021, 2024) reflect its strong workforce and economy, but its 2025 win was tempered by trade war vulnerabilities (e.g., Wilmington port traffic). The methodology’s focus on economy and new trade metrics favored its strengths.
Close Competition: The 2024 rankings saw the tightest finish ever, with just three points separating Virginia (1,595) and North Carolina (1,592), highlighting how granular metric additions increase competition.
Critical Analysis
Strengths: The evolving methodology ensures relevance by incorporating trends like AI, climate resilience, and trade policy. The data-driven approach and third-party partnerships enhance objectivity. Dynamic weightings align with what businesses value, as reflected in states’ marketing.
Limitations: The reliance on states’ marketing pitches to set category weights may favor states with stronger PR over actual performance. New metrics (e.g., trade war risks) introduce complexity that may not fully capture long-term impacts. The methodology’s focus on business priorities may undervalue worker-centric factors, as seen in North Carolina’s low Quality of Life ranking despite its top spot.
Skepticism of Narrative: Rankings can oversimplify complex economic realities, as noted by economic development professionals who caution against over-relying on them for site selection. States like Virginia and North Carolina consistently rank high, but this may reflect methodological biases toward education and infrastructure rather than a complete picture of business climate.
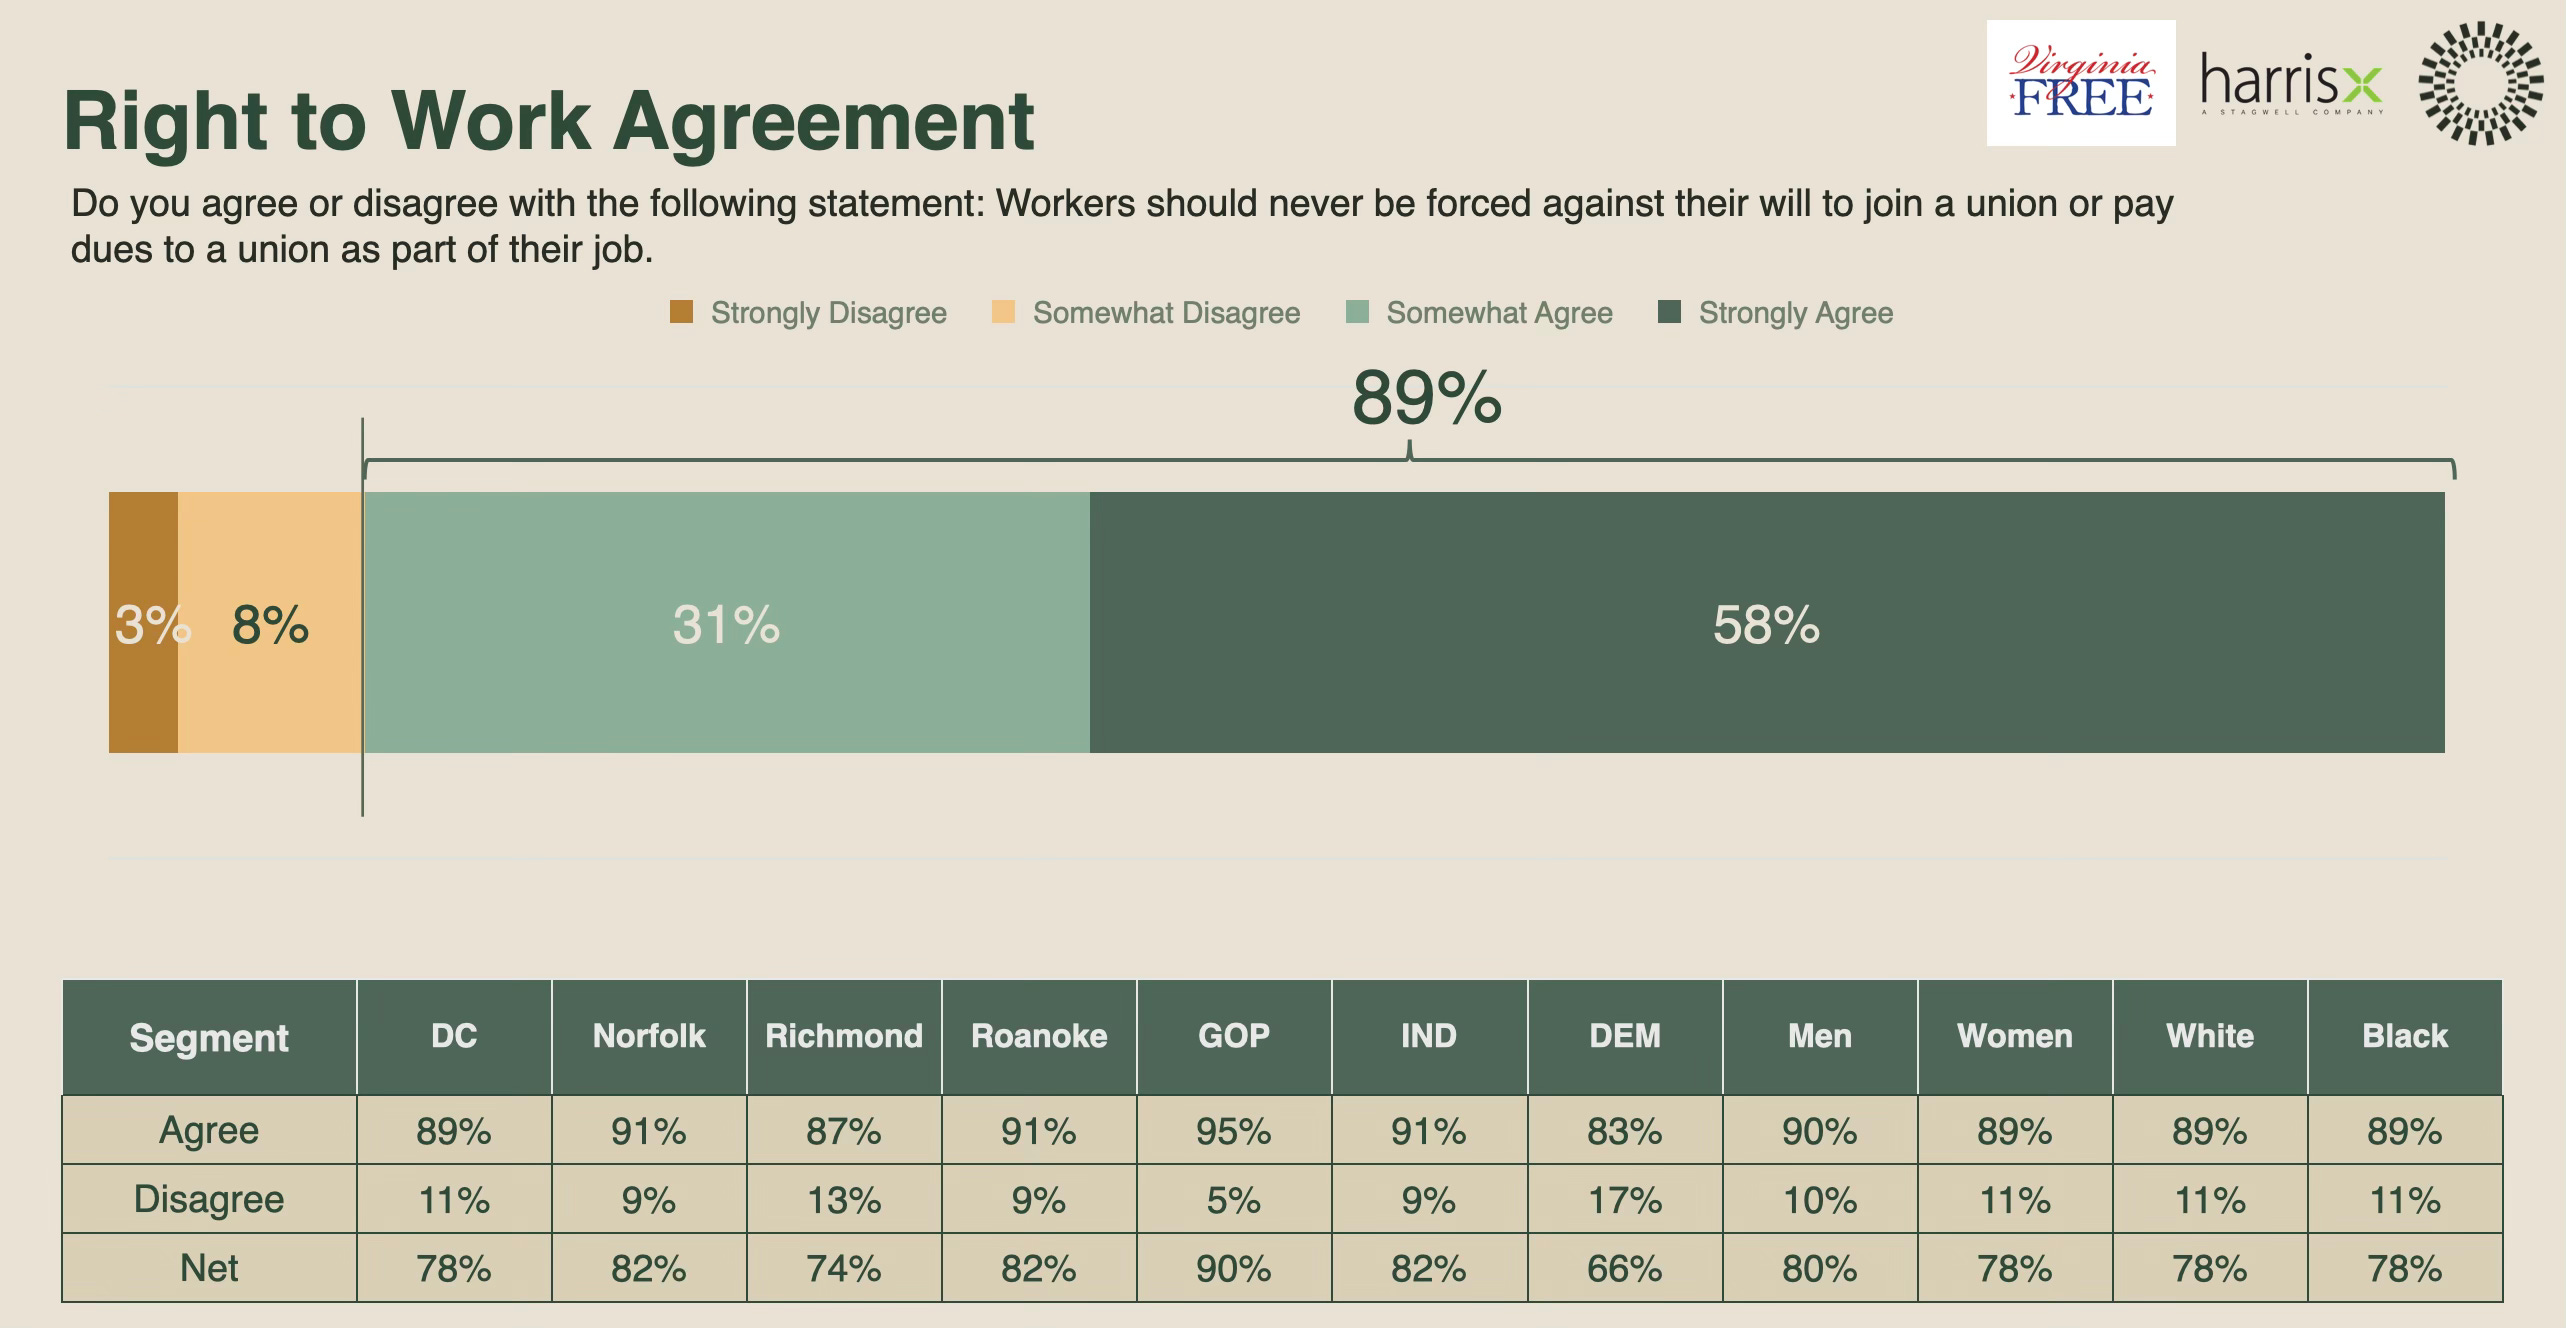
Oh and don’t touch Right to Work